Drying Late-harvested Soybeans?
Prepared by Sam McNeill, Extension Agricultural Engineer, University of Kentucky Biosystems & Agricultural Engineering, Research and Education Center, Princeton, KY. Email: smcneill@uky.edu.
Kentucky grain farmers are still struggling to finish harvesting soybeans in many parts of the state this year. Intermittent rain and/or snow have made for wet soils and poor field drying conditions, which can negatively impact grain quality and storability. While heated air drying is the fastest way to prepare late harvested crops for storage, bin drying with no/low heat (5 to 10 degrees) is often a more readily available second choice. This article focuses on natural aid and low temperature (NA/LT) bin drying systems and follows information shared earlier on the equilibrium moisture levels which set the allowable storage time for a specific crop.
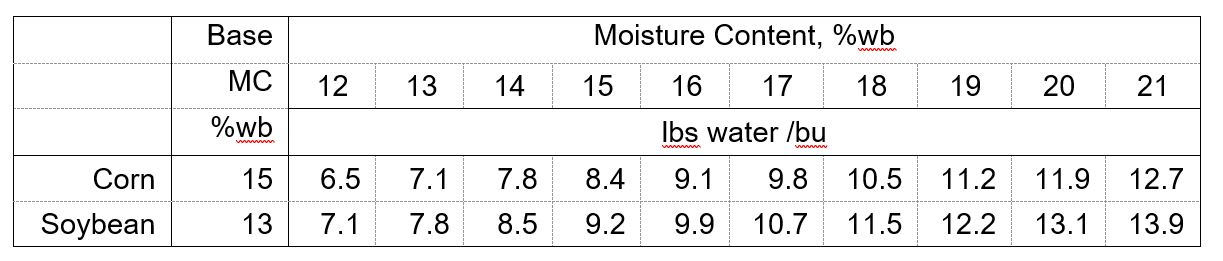
The time required for drying grain to an average target moisture level depends on the incoming grain moisture and temperature, the average drying air temperature and relative humidity, and the airflow rate. Drying soybeans from 18% to 13% removes 3.7 lb of water per bushel, which is about the same as drying corn from 20.3% to 15% (Table 1).
Table 1. Amount of water in a bushel of corn and soybean at different moisture levels.
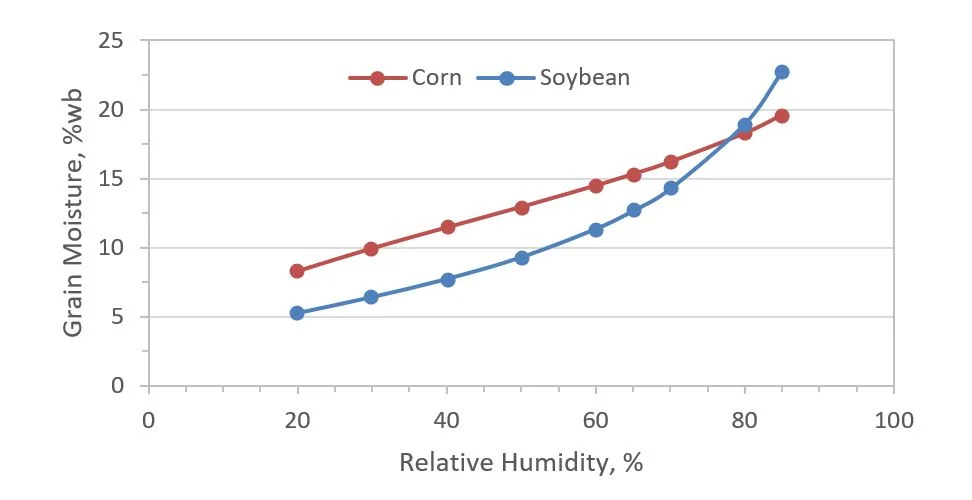
Even though soybeans don’t dry exactly like corn, corn drying models can be used to estimate the drying time for soybeans by adjusting the initial and final moisture levels based on the corresponding EMC values. Fig. 1 shows that the equilibrium moisture content (EMC) values for corn and soybean at 78% RH and 40F are equal (17.8%) but differ by 2 points or more at 65% RH, which is the recommended storage condition. Moreover, it is important to recall that EMC decreases with increasing air temperatures. Conditions above the lines shown in Fig. 1 represent higher temperatures where drying will occur, but below the lines conditions are below 40 F and grain will not dry (but may gain moisture).
Figure 1. Equilibrium moisture content (%wb) of yellow corn and soybean for different relative humidity values at 40 F. Source: ASABE, 2017.
Airflow also influences drying time so it’s important to know how much air is delivered at different grain depths. The University of Minnesota WINFANS program (http://webapps.bbe.umn.edu/fans/) is freely available and contains air delivery data for over 400 commercial fans from most manufacturers. As an example, Table 2 shows the results of a 5-, 7.5- or 10- hp axial fan on a 30-ft diameter bin. As seen, the 7.5-hp fan will provide 2, 4, and 11 cfm/bu when filled to a depth of 10 ft (5655 bu), 5 ft (2830 bu), or 2 ft (1130 bu), respectively.
Table 2. Airflow for clean soybeans at different depths in a 30-ft diameter bin with a 5, 7.5 and 10 hp axial fan.

These airflow rates were then used to simulate drying soybeans from 18% to 13% with air conditions predicted for the coming week in western Kentucky. A second evaluation was made by adding 5-10 degrees of heat to the outside air to lower the relative humidity at night and on cloudy days. Results are shown in Table 3 for a range of airflow rates found in Table 2.
Table 3. Drying times for soybean at 40oF and 50oF at different humidity levels and airflow rates.

Figs. 2 and 3 show the moisture changes with time for the bottom, middle and top layers of the bin for airflow rates of 2 and 10 cfm/bu, respectively. Both simulations stopped when the top layer reached the desired final moisture. Note that the bottom layer reaches the desired final moisture quickly, but is then soon overdried by 2 points, the middle layer dries at a steady rate, and the top layer doesn’t even start to dry until late in the process. Comparing the two figures illustrates that decreases in airlow stretch the time line proportionately (5 fold in this case). Overdrying in the bottom and middle layers occurs in these examples because the drying air RH (55%) is 10 percentage points below the equilibrium RH (65%) for beans at the desired 13% moisture content. These figures show that the drying front can be monitored by checking grain moisture content 1 or 2 feet below the grain surface at the top of the bin. When near 13%, drying is complete. Drying below this level allows soybeans to be stored safely into late spring and/or summer.
Figure 2. Days needed to dry soybeans from 18% to 13% with average temperature and humidity of 50 F and 55% and an airflow rate of 2 cfm/bu. (Note that the bottom and middle layers are overdried.)

Figure 3. Days needed to dry soybeans from 18% to 13% with average temperature and humidity of 50 F and 55% and an airflow rate of 10 cfm/bu. (Note that the bottom and middle layers are overdried.)

Lastly, several simulations were made to provide estimates for the time required to dry soybeans at different harvest moisture levels and under conditions that can be provided with little or no heat/NA/LT and an airflow rate of 2 cfm/bu. Under these conditions we’re looking at 11 to 28 days. If higher airflow rates can be achieved by reducing grain depth in the bin, the drying time will be reduced proportionately.
Table 4. Days needed to dry soybeans to 13% with 2 cfm/bu at different air conditions.

Mother Nature has given Kentucky some unusually mild weather in the short run, Hopefully, this will continue a bit longer so that grain harvest will finish this month.